Download&Revenue Top Charts Guide
Ⅰ. Benefits
Through three rankings, you could quickly find out: the most successful app in the industry, the fastest growing app and the best performing rookie app. It provide you with operation and marketing ideas, determine the objects to imitate and catch up with.
Ⅱ. How to Use
The core value of the download revenue list is the estimated data supported by the accurate model of ASOTools. All success or failure of an App is based on the amount of application downloads and application revenue. For IAP applications, revenue is the core indicator; for applications that rely on advertising implantation as the core of revenue, the download volume represents the most authoritative indicator.
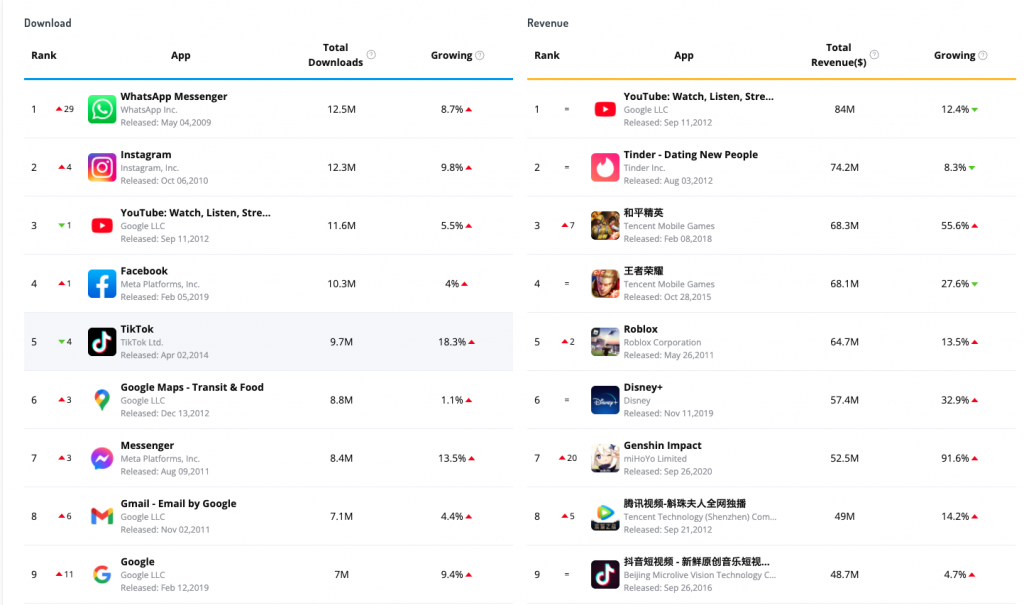
1. Ranking Chart
It represents the most comprehensive ranking. All applications can have a place on it, while the premise is that your performance is good enough!
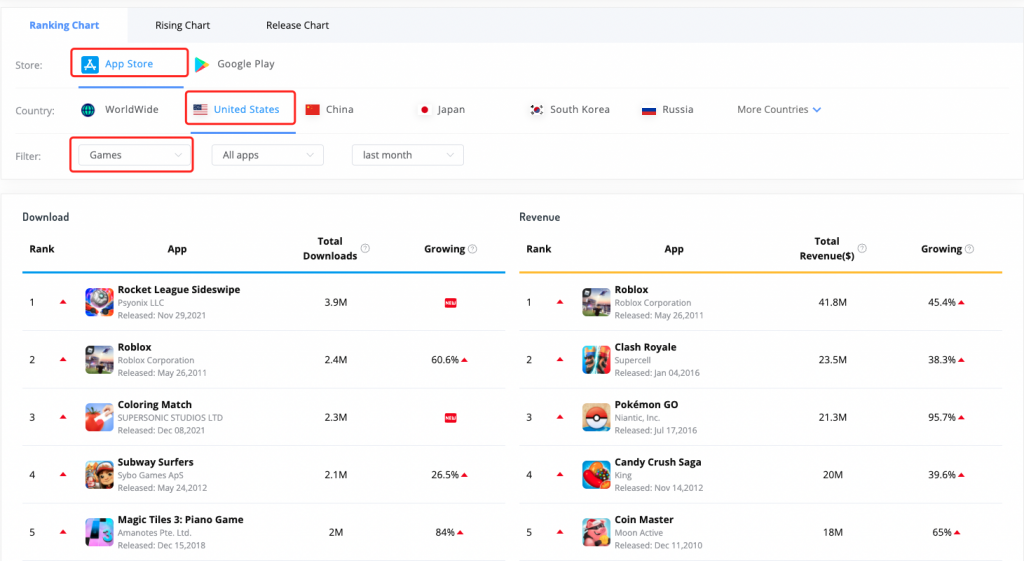
Two platforms are supported here, including global ranking and ranking by country and region. In further screening, you can also distinguish between game categories and application categories, or even more subdivided categories, such as action games or book tools. At the same time, we also support distinguishing whether it is IAP or not. The data statistics dimension here supports the total ranking of download revenue data from last month to recent year.
Finding industry leaders and app headers relies on this chart! Click each application to see the detailed information pop-up window, which supports more information viewing. If these are not enough, try to subscribe, then view all historical information and get day level data updates.
2. Rising Chart
The Rising Charts is the most equal list. This equality means that even for applications developed by individual developers could rank on this list as long as your recent download revenue data has increased by leaps and bounds. This is because we have set two options: ranking by growth value and ranking by growth rate. Your growth value may be difficult to catch up with the giants, but you can still double the growth to occupy the top of the rising rate chart.
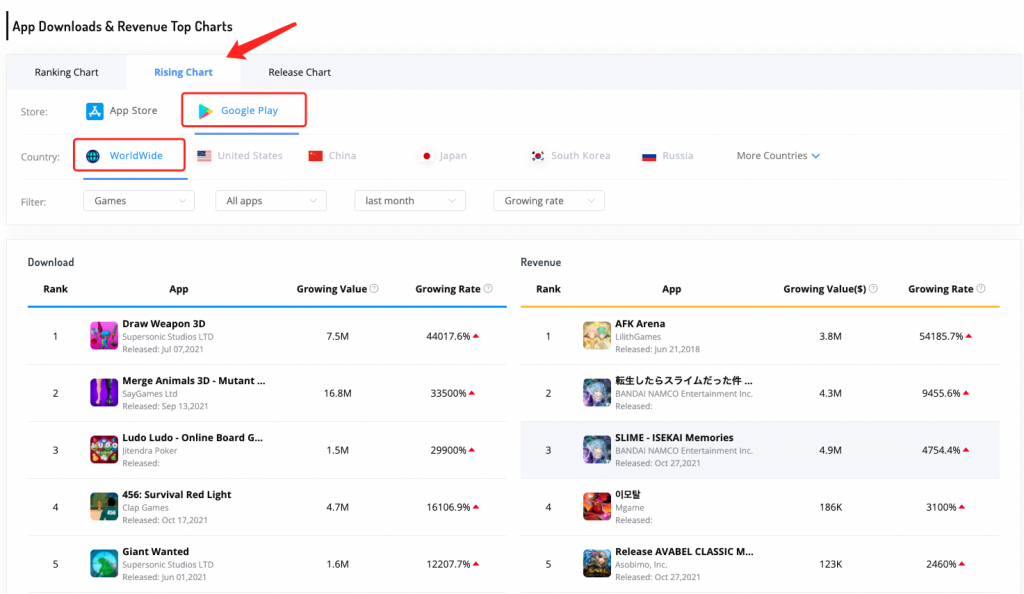
Like the Ranking chart, it also supports the filtering of various data categories to facilitate you to find your own subdivided fields. The rising chart supports the data soaring month on month ranking of last month and the data soaring month on month ranking of recent 3 months, which is convenient to view the application performance in different time periods. Is it a flash in the pan or continuous force?
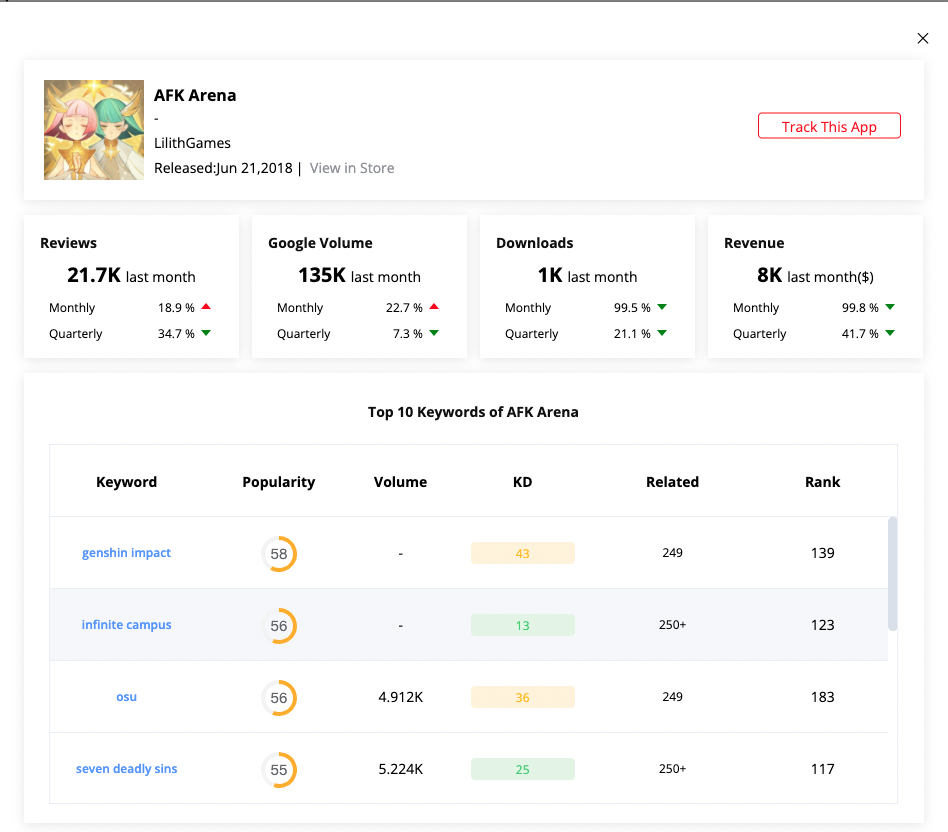
Again, click each application to see the detailed information pop-up window, which supports more information viewing. If these are not enough, try to subscribe, then view all historical information and get day level data updates.
3. Release Chart
Just like the rookies among the singers and NBA, we have also selected app rookies among many newly released apps. Which applications can occupy a place in the market just after they are released? Let's help you count! What did they do? From application content to advertising and marketing operations, it must be worth learning from other app developers.
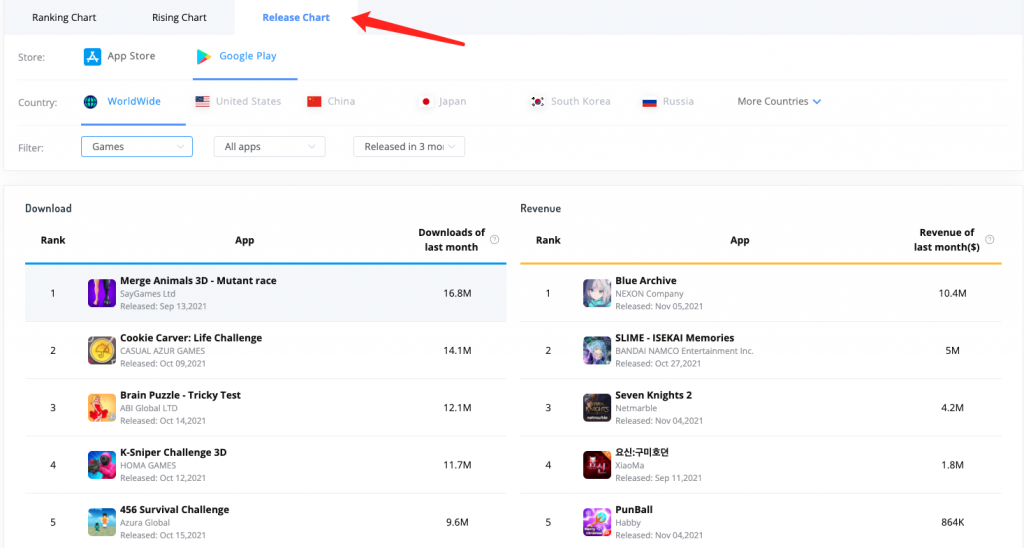
Like the Ranking Chart, it also supports the filtering of various data categories to facilitate you to find your own subdivided fields. The evaluation of the rookie list supports the evaluation of apps that have been on the shelves in recent three months and nearly six months. Again, click each application to see the detailed information pop-up window, which supports more information viewing. If these are not enough, try to subscribe, then view all historical information and get day level data updates.