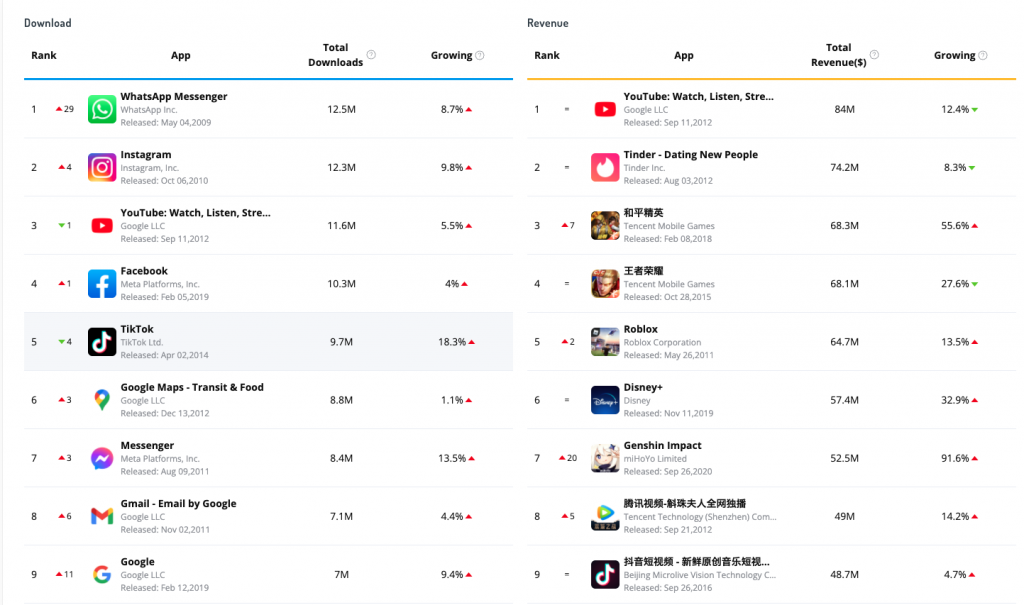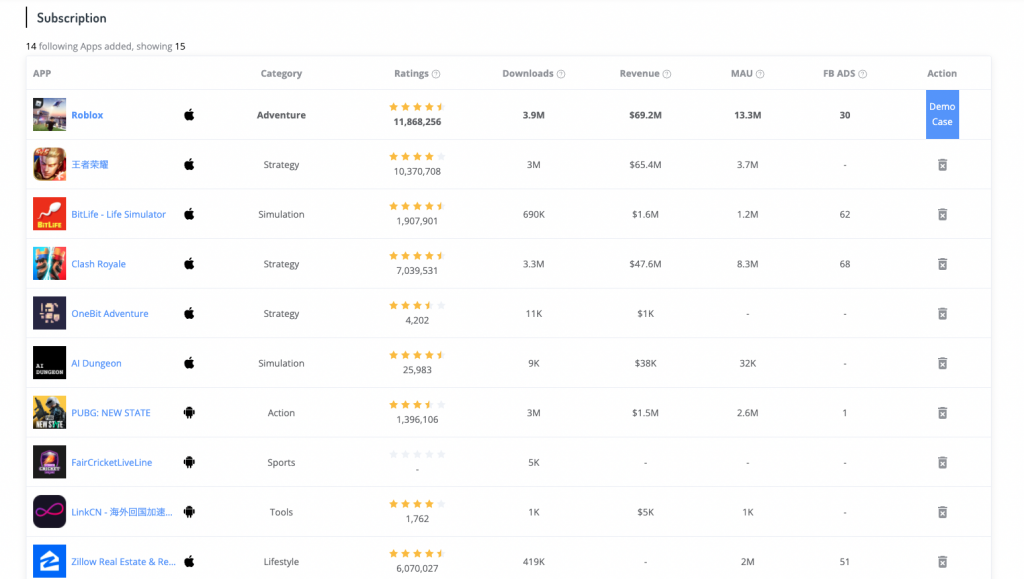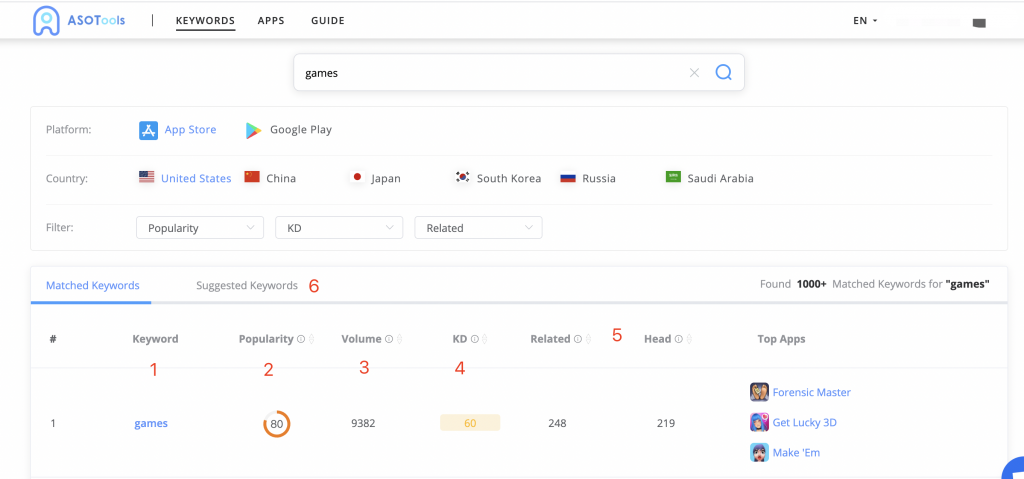
As well known by users, one of the core functions of ASOTools at current stage is app download & revenue estimation. However, since the function was launched, with the algorithm model constantly updated and optimized, have you already got how to use it? As a small and medium-sized developer, does the download revenue estimation data of those head apps have no significance for me as a reference? Why do functions worth thousands of dollars on many tools seem to make no sense to me? Many users will have above questions. At present, a large number of developers regard app analysis platforms as tools that can only be used as ASO optimization reference. In fact, it is more than ASO. Learn to read app download revenue data and master application analysis skills and therefore you will become an excellent developer.
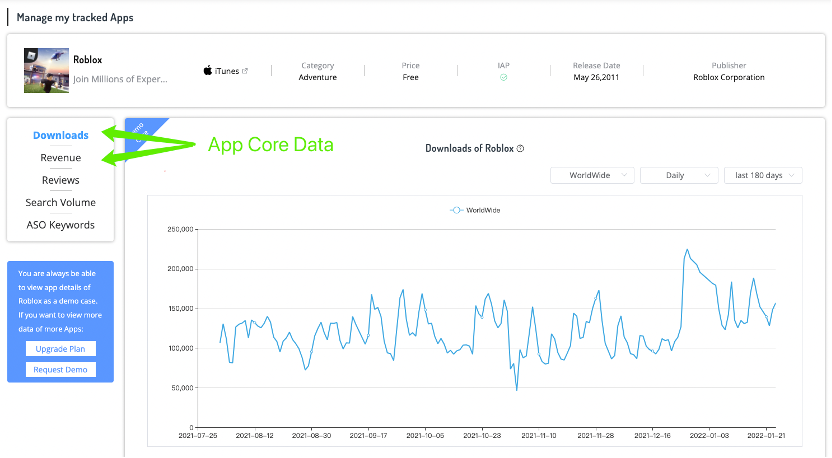
1. What is the value of App download revenue data?
Just as whenever we want to understand a country's economic development level, we look at the country's GDP, when we want to check the operation of a listed company, we need to consult its annual report. In order to understand the current situation of an App, we should get to know its revenue. The best indicator to measure the state of the national economy is GDP. The operating income on the profit statement of an enterprise's annual report is the most core indicator, which reflects the scale, profitability and viability of the enterprise. The revenue data of an application reflects its current product iteration, user scale, operation and other aspects. The download volume is the most direct embodiment of the current application situation. It is basically equal to the current app market heat and value.
2. How can I use app download and revenue data?
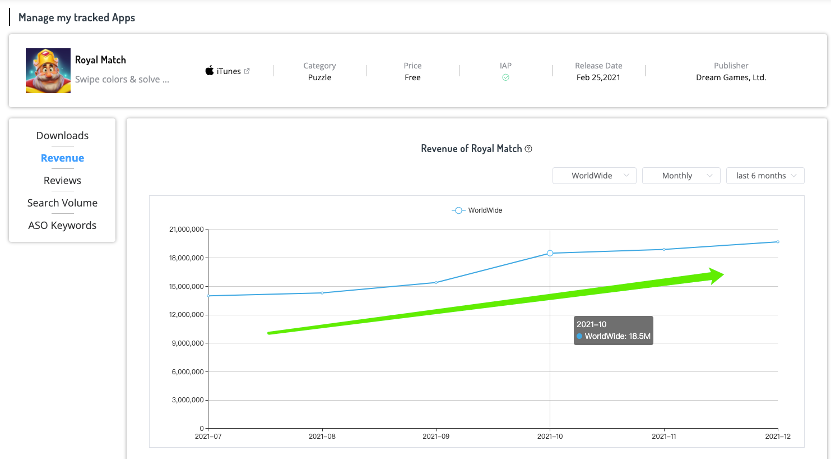
First of all, read the download revenue data vertically. The growth rate of three consecutive cycles is a key indicator, from which we can see the growth capacity of app. If the growing rate is more than 20% in three consecutive months, it is certain that this is an app in a period of stable growth. If the growth rate is fluctuating 10% up and down, it is an App whose business is close to the ceiling. If the growth rate is negative continuously, we should carefully consider various factors that trigger the decline. We need to look at the specific situation of App in combination with other indicators to see whether it means entering a bottleneck or recession.
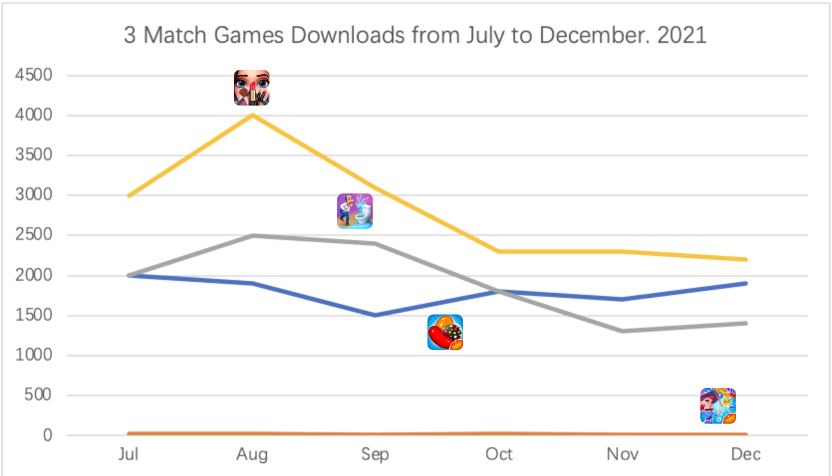
Secondly, browse the download revenue data horizontally and make a comparison. If two apps with the same level of downloads do not have the same level of revenue, it is necessary to deeply investigate the differences in their product strategies, user groups and subscription pricing, then draw further conclusive analysis.
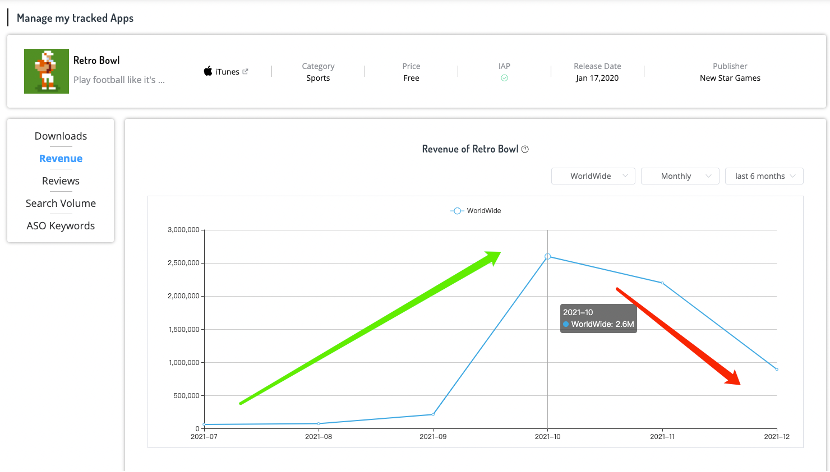
Moreover, when competing products and applications are advancing hand in hand, an app itself suddenly begins to decline. Its product strategy and recent version updates are worth to be in-depth studied and deliberated. How to avoid stepping on bombs and avoiding pits are worth learning. Similarly, the applications that can stand out in the competitive products at the same level are also worth to be learned from.
In this way, even if you are a small and medium-sized developer or even an individual developer who is difficult to stir up the app market, you can still benefit a lot from downloading revenue data. How to use the data? How to analyze the events? It is according to your own research case by case.
3. Is the data of ASOTools accurate?
Admittedly, no analysis tool or consulting company in the market gives 100% accurate download revenue data, unless some platforms violate their commitments and open the data bounded by users to the others without processing. Therefore, the only conclusion of the data is to predict through the model - we have been proud to boast our data prediction model, its accuracy is no worse than any other app platforms. We rely on the real data of hundreds of cooperative institutions and more than thousands of apps, we also capture the 24-hour keyword ranking of the official store platforms. At the same time, with the help of the number of advertisings, the total amount of Google search data and the data comparison of other multiple ASO platforms, we update the estimated data and optimize the estimated model, so as to help you make more accurate business decisions. In popular countries and regions, the data estimation error of the list application is within 10%. If you encounter data problems in the process of use, you are also welcome to feed back to us.

4. With the same functions and better data, why is the price plan of ASOTools much lower than that of competitive products?
Through the pricing comparison of several successful friends in the industry, it is not difficult to find that on the premise that the data accuracy is no worse than any other app platforms, the price advantage of ASOTools in data is very obvious. It mainly benefits from the following two reasons.
First of all, we are committed to serving small and medium-sized developers. Along the way, we have get in touch with a lot of individual developers. We know that the cost of each developer is limited and valuable, so we are willing to provide the best data services at the lowest price. We hope you can put more costs and plans into product research and development. We cherish every developer who meets us in the app industry and are willing to treat you sincerely.
Secondly, in the face of many competitors in the market, ASOTools is still in its infancy, the product functions are still being polished. Therefore, we humbly collect users' product suggestions and functional requirements, hoping to get more users as a lower prices, so as to get more feedback from developers.
